Visualizing MIDI file embeddings
MIDI Vector visualization
I was working for Marc Bedau, a Philosophy professor at Reed College who was working with scientists to understand the deep nature of real work problems. Eventually, I started getting going on my own project. This project was to use the word2vec and doc2vec unsupervised learning algorithms to embed audio files into a space where notions of movement, distance, etc, correspond to changes in the actual nature of the music. Using more advanced clustering tools the professor was working with, he was even hoping to understand musical change over time.
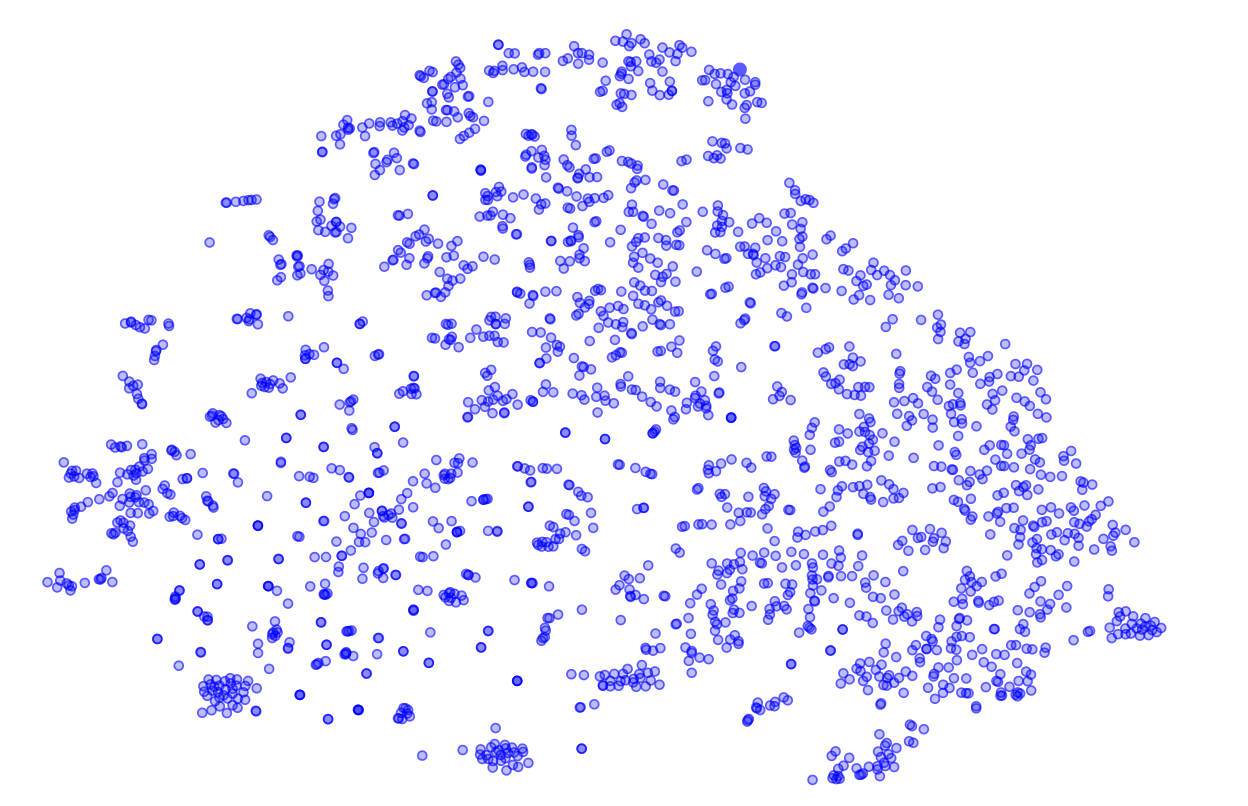
A MIDI file, at its simplest, is just a sequence of notes/chords, durations and volumes. I simply ignored the volumes and durations, and treated it as a sequence of chords (a chord is a combination of notes). The word2vec algorithm was then applied to this, placing each chord into a high dimentional (80 dimensions) vector space, based on what sorts of chords tend to be its close neighbors (within a 3 length window). This high dimentional embedding space is known to be well behaved, and notions of distance and relative position are quite robust. However, it is hard to visualize. So I used TSNE to put it onto a low dimentional space, so that you can understand which vectors are closer to one another.
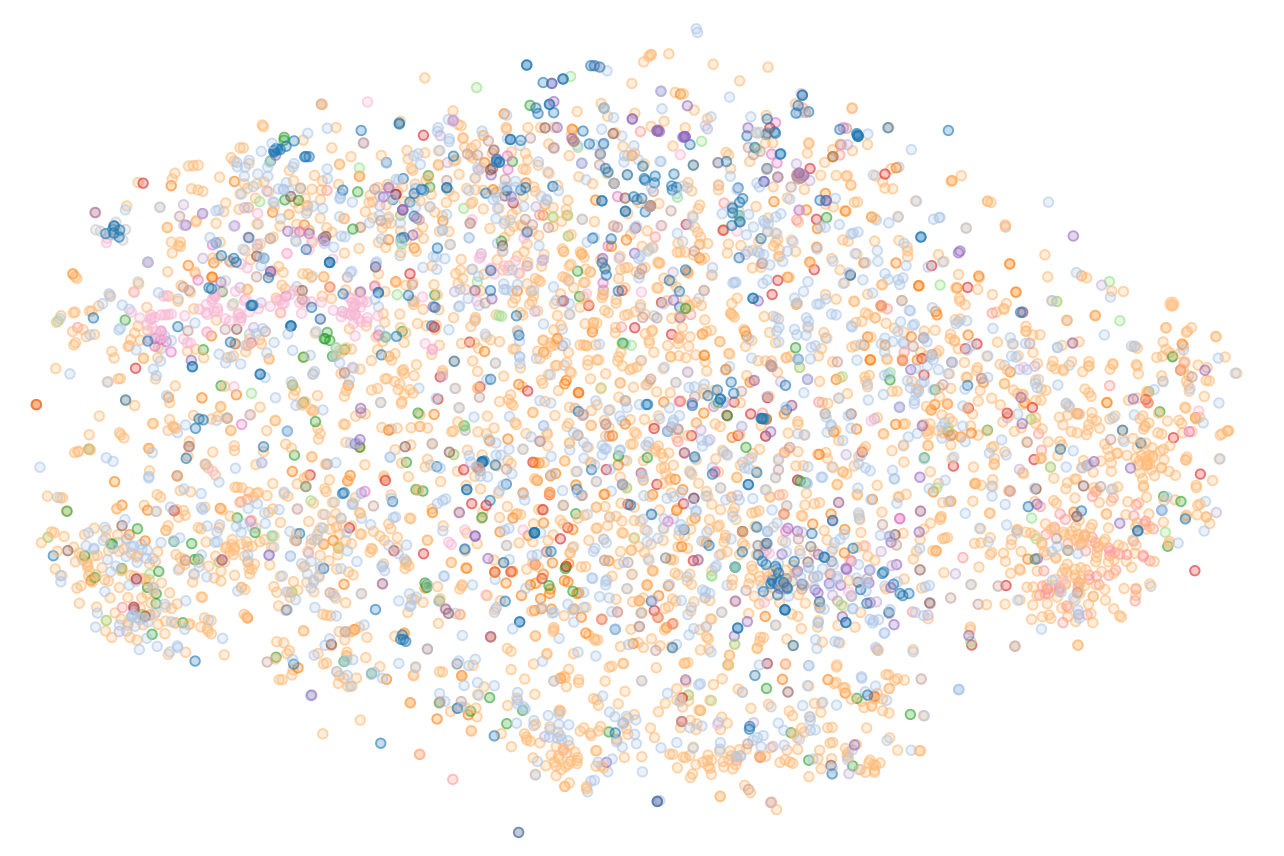
Similarly, doc2vec embeds the whole MIDI file based on the overall distribution of its chords relative to other files.
Once the machine learning algorithm embedded the chords and files and placed them onto their respective surfaces, I had it output some data files that the frontend could read. I allowed users to click on this frontend to play the song or chord to see if they agree that neighboring points are similar. I also allowed them to see if relationships between the chords made sense. Below is the deployed visualization, trained on and displaying the free midiworld dataset.
Chord visualization
File visualization
Full code for the project here
After this visualization, I was disturbed by the low quality of the document associations (though some of the chord similarities are interesting). I blamed throwing out the durations and volumes, and I could not figure out a better way to preprocess the MIDI file, other than just to have it generate the actual audio. So I started insisting that only true raw audio, not MIDI files, should be processed in order for this analysis to be sufficiently general. That insistence led to one of my most successful projects ever, the sound-eval project (project post here). I was even able to reuse a lot of my visualization code there, and improve upon it.