Fast, Simple Rectangular Search
References
Box intersection
Fast box intersection is a foundational 2d geometry problem. Due to their simple structure, boxes are used as a key primitive in many 2d graphics and physics systems, as well as being an important step in computer vision tasks.
We will investivate two key tasks, which are related and very similar.
- Given a large number of possibly overlapping rectangles in a large space, compute the intersection graph of the rectangles
- Build a data structure which allows you to enumerate all the rectangles in the dataset that intersect with a given box in less than O(n) time.
For either problem, our input might look something like this when rendered onto the screen:
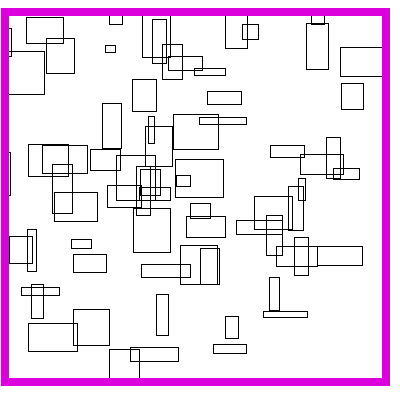
Of course, the boxes themselves are represented with their coordinates, not with pixels. Something like this:
# Boxes are left-anchored
# Format: (x,y,width,height)
boxes = [
    [1,1,1,2],
    [0,0,5,5],
    [2,3,2,6],
]
Full up-to-date code and documentation is on github.
Reduction to a single dimension
A first idea to solve this 2d box overlap problem is to reduce it to a 1d interval overlap problem across the x axis, followed by brute force search across the y axis.
Left-Right line search (for 1-dimensional reduction)
To do full, dense pairwise interval overlap comparisons (problem 1 above), a simple left-to-right search is used.
Consider the following intervals, sorted by their left coordinate (we can keep track of where the interval originally was by simply attaching some metadata to the box struct in the computation):
1.   |--------|
2.     |------------------------|
3.          |--------|
4.            |----|
5.                  |--------|
6.                             |--------|
Let i represent that index in the sorted list.
Note that all the intervals to the right of interval i are placed immidiately after i in the sorted list—-once you find one interval to the right of i that does not intersect with it, there will never be another one anywhere else in the sorted list that is to the right.
So you can use this fact to easily build a directed graph of intervals pointing to all intervals to the right of them (psedocode)
sorted_intervals   # list of (left, right) tuples
intervals_to_the_right(i) = [j for j in range(i+1,len(sorted_intervals)) while sorted_intervals[i].right > sorted_intervals[j].left]
Note that this step is linear in the number of interval overlaps m plus the number of nodes n—every overlap is counted once, no work is done for any intervals which are not there. So it is essentially optimal
Once you have that directed graph of left-to-right in an adjacency list, you can simply invert all the edges to get the right-to-left graph, and combine them to get the undirected overlap graph. This also takes linear time.
Below is a visualization of this proceedure. The bolded box is the box currently searched. The yellow region is the brute force search space. The blue boxes are the boxes to the right that the search finds, the green boxes are the boxes found by inverting the graph (no search needed, it has already completed).
As for theoretical performance, the complete run-time of this algorithm is dominated by the original sort plus the number of actual interval intersections: n * log(n) + m.
Finally, we need to check that all the intersections found along the x axis also intersect on the y axis
One noteable implementation detail is that this check along the y axis should be explicitly coded inside the loop, rather than a post-processing step after the x-axis adjacency list has already been built, because this check is much faster than actually building/consuming the list, and this y-axis check takes the vast majority of the time on relatively dense datasets.
While asymtotically suboptimal, the resulting methods result in highly parallizable, cache-local, and predictable code flows, resulting in great performance on most datasets, and essentially optimal performance on very sparse datasets.
Since only the x dimension is optimized, the time efficiency of this library does depend on the boxes being spread broadly across the x axis. However, rest assured that the accuracy and memory efficiency of this library remains regardless of the size and positions of the boxes.
For more details, see the implementation on github.
Interval tree (for 1-dimensional reduction)
For the online box-intersection problem (problem #2), the above line-search based solution is inefficient, as the list is only sorted by the left side of the boxes, and has no information about the right side.
An interval tree is a well known algorithm for online comparison of one interval against a static set of intervals. This algorithm is well known, as it is in the famous “Introduction to Algorithms” CLRS textbook. The key idea is to keep the list of sorted intervals from before, but add information about the right side of subsets of intervals in a tree structure.
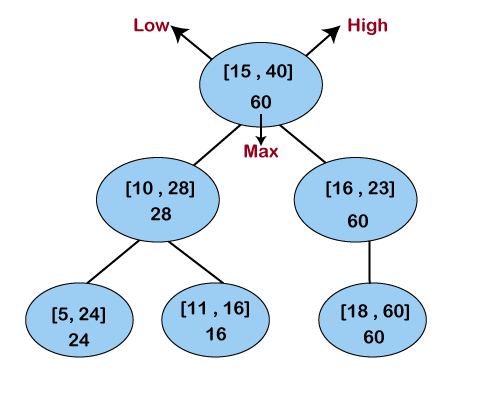
A query is a simple recursive search down this tree, which is efficient because if a node’s min and max does not overlap with your query’s min and max, then none of the children need to be searched. Like before, the y axis will be checked for all overlapping intervals for the
Specific implementation details:
- Since the tree is not added to, then unlike the implementation in CLRS, a ballanced interval tree can be built in n time via a simple bottom-up construction.
- The base of the tree is sorted by left cooridnate before the tree is constructed. This means that nearby intervals are placed close together, reducing search cost from k* log(n) to k + log(n) assuming uniform interval length. However, the sorting step does increase one-time cost of building the tree from n to n*log(n).
- Instead of a binary tree, a b-tree of size 8 is constructed.
For more details, see the implementation on github.
Recursive Tile Sort (RTS) RTree
To do better than the above, we must build an algorithm/data structure which incorperates information about both dimensions. Note that naively, you cannot sort along both dimensions, as sorting in one dimension completely destroys the order along the other dimension. So we must be a little bit clever about how to sort along both dimensions.
The idea is to cleverly construct an efficient RTree. An RTree is essentailly a 2 dimensional interval tree. Each node in the tree is a bounding box around a set of subnodes. The subnodes may overlap with each-other, but are all contained within the parent. This data structure can be efficient because if the query does not intersect with the parent node, then it does not intersect with any of the children. To make this data structure efficient, the amount of unnecessary overlap between sub-nodes must be limited, while keeping the tree balanced.
The idea is build the tree top-down, by recursively sorting and partitioning the data, swapping partiion axes on each recursion. Each partition becomes a node in the tree. The recursive partitioning stops when there are too few boxes to be worth continuing. The key to maintain efficiency is to partition the data according to k-statistics, rather than on any fixed tileing strategy. Note that any method to build a valid R-tree will result in correct output, this recursive tile sort method is only used to build an efficient (flat) R-tree.
For more details, see the implementation on github.
Benchmark results
Running the following commands on my laptop (subject to signifiant noise):
python benchmark/run_benchmark.py --num-boxes 10000000 --region-size 100000 --max-box-size 100 --test-iterations 2
python benchmark/run_benchmark.py --num-boxes 1000000 --region-size 40000 --max-box-size 100 --test-iterations 5
python benchmark/run_benchmark.py --num-boxes 5000000 --region-size 40000 --max-box-size 100 --test-iterations 1
python benchmark/run_benchmark.py --num-boxes 10000 --region-size 4000 --max-box-size 100 --test-iterations 200
python benchmark/run_benchmark.py --num-boxes 50000 --region-size 4000 --max-box-size 100 --test-iterations 200
python benchmark/run_benchmark.py --num-boxes 100 --region-size 400 --max-box-size 100 --test-iterations 5000
python benchmark/run_benchmark.py --num-boxes 500 --region-size 400 --max-box-size 100 --test-iterations 5000
| num boxes | num intersections | find_intersecting_boxes_t | find_intersecting_boxes_linesearch_t | find_intersecting_boxes_asym_t | BoxIntersector build | BoxIntersector query sequentially |
|---|---|---|---|---|---|---|
| 10000000 | 98121408 | 13.105241650999233 | 154.04933043200072 | 20.2212505460011 | 1.3013974820023577 | 76.27041031999397 |
| 1000000 | 6146414 | 1.079791784400004 | 4.057212820200948 | 1.3800189660003526 | 0.11809377160097938 | 3.3368717799748993 |
| 5000000 | 153641310 | 8.694388069001434 | 97.42901271900337 | 11.404364986003202 | 0.6341686070009018 | 37.24578465000377 |
| 10000 | 63926 | 0.00756414039999072 | 0.007507104474971129 | 0.00862623918997997 | 0.0012969420700028422 | 0.02802324460062664 |
| 50000 | 1596320 | 0.07102527560502495 | 0.12549703109998517 | 0.07688932022498193 | 0.006260708160007198 | 0.1735435572001734 |
| 100 | 980 | 3.716685980034526e-05 | 3.39350940004806e-05 | 3.4409700801188594e-05 | 4.7531824006000536e-06 | 0.00015588611201383174 |
| 500 | 21858 | 0.0007922569953996572 | 0.0005067257845992572 | 0.0008053314156000851 | 2.8699655600939877e-05 | 0.0014579397200141103 |
Python wrapper examples
Install with pip install fast-box-lib-py
Usage:
import fast_box_lib_py
import numpy as np

# input is numpy array of boxes.
# boxes are left-anchored (x,y,width,height)
boxes = np.array([
    [1,1,1,2],
    [0,0,5,5],
    [2,3,2,6],
],dtype="int32")

detector = fast_box_lib_py.BoxIntersector(boxes)
query_box = (0,0,2,2)
intersecting_idxs = detector.find_intersections(*query_box)
print(intersecting_idxs) # [0, 1]
Follow up projects
Note that this project has inspired others, including this one about rectangle cover